Simulation
Run a strategy through hundreds of sessions in seconds, and finally see how it really performs.
Anyone can get lucky for an hour. The real test of a strategy is how it does over thousands of spins, played out across many independent sessions, where lucky streaks and bad streaks have time to even out. That's what simulation is for. Spin Savvy can play out a strategy for you, automatically, much faster than real time, then hand you a chart and a stat sheet.
Starting a simulation
Open any strategy's overview page and tap the Sim button. (You can find it next to the Play button.) That takes you to the simulation setup screen.
Setting it up
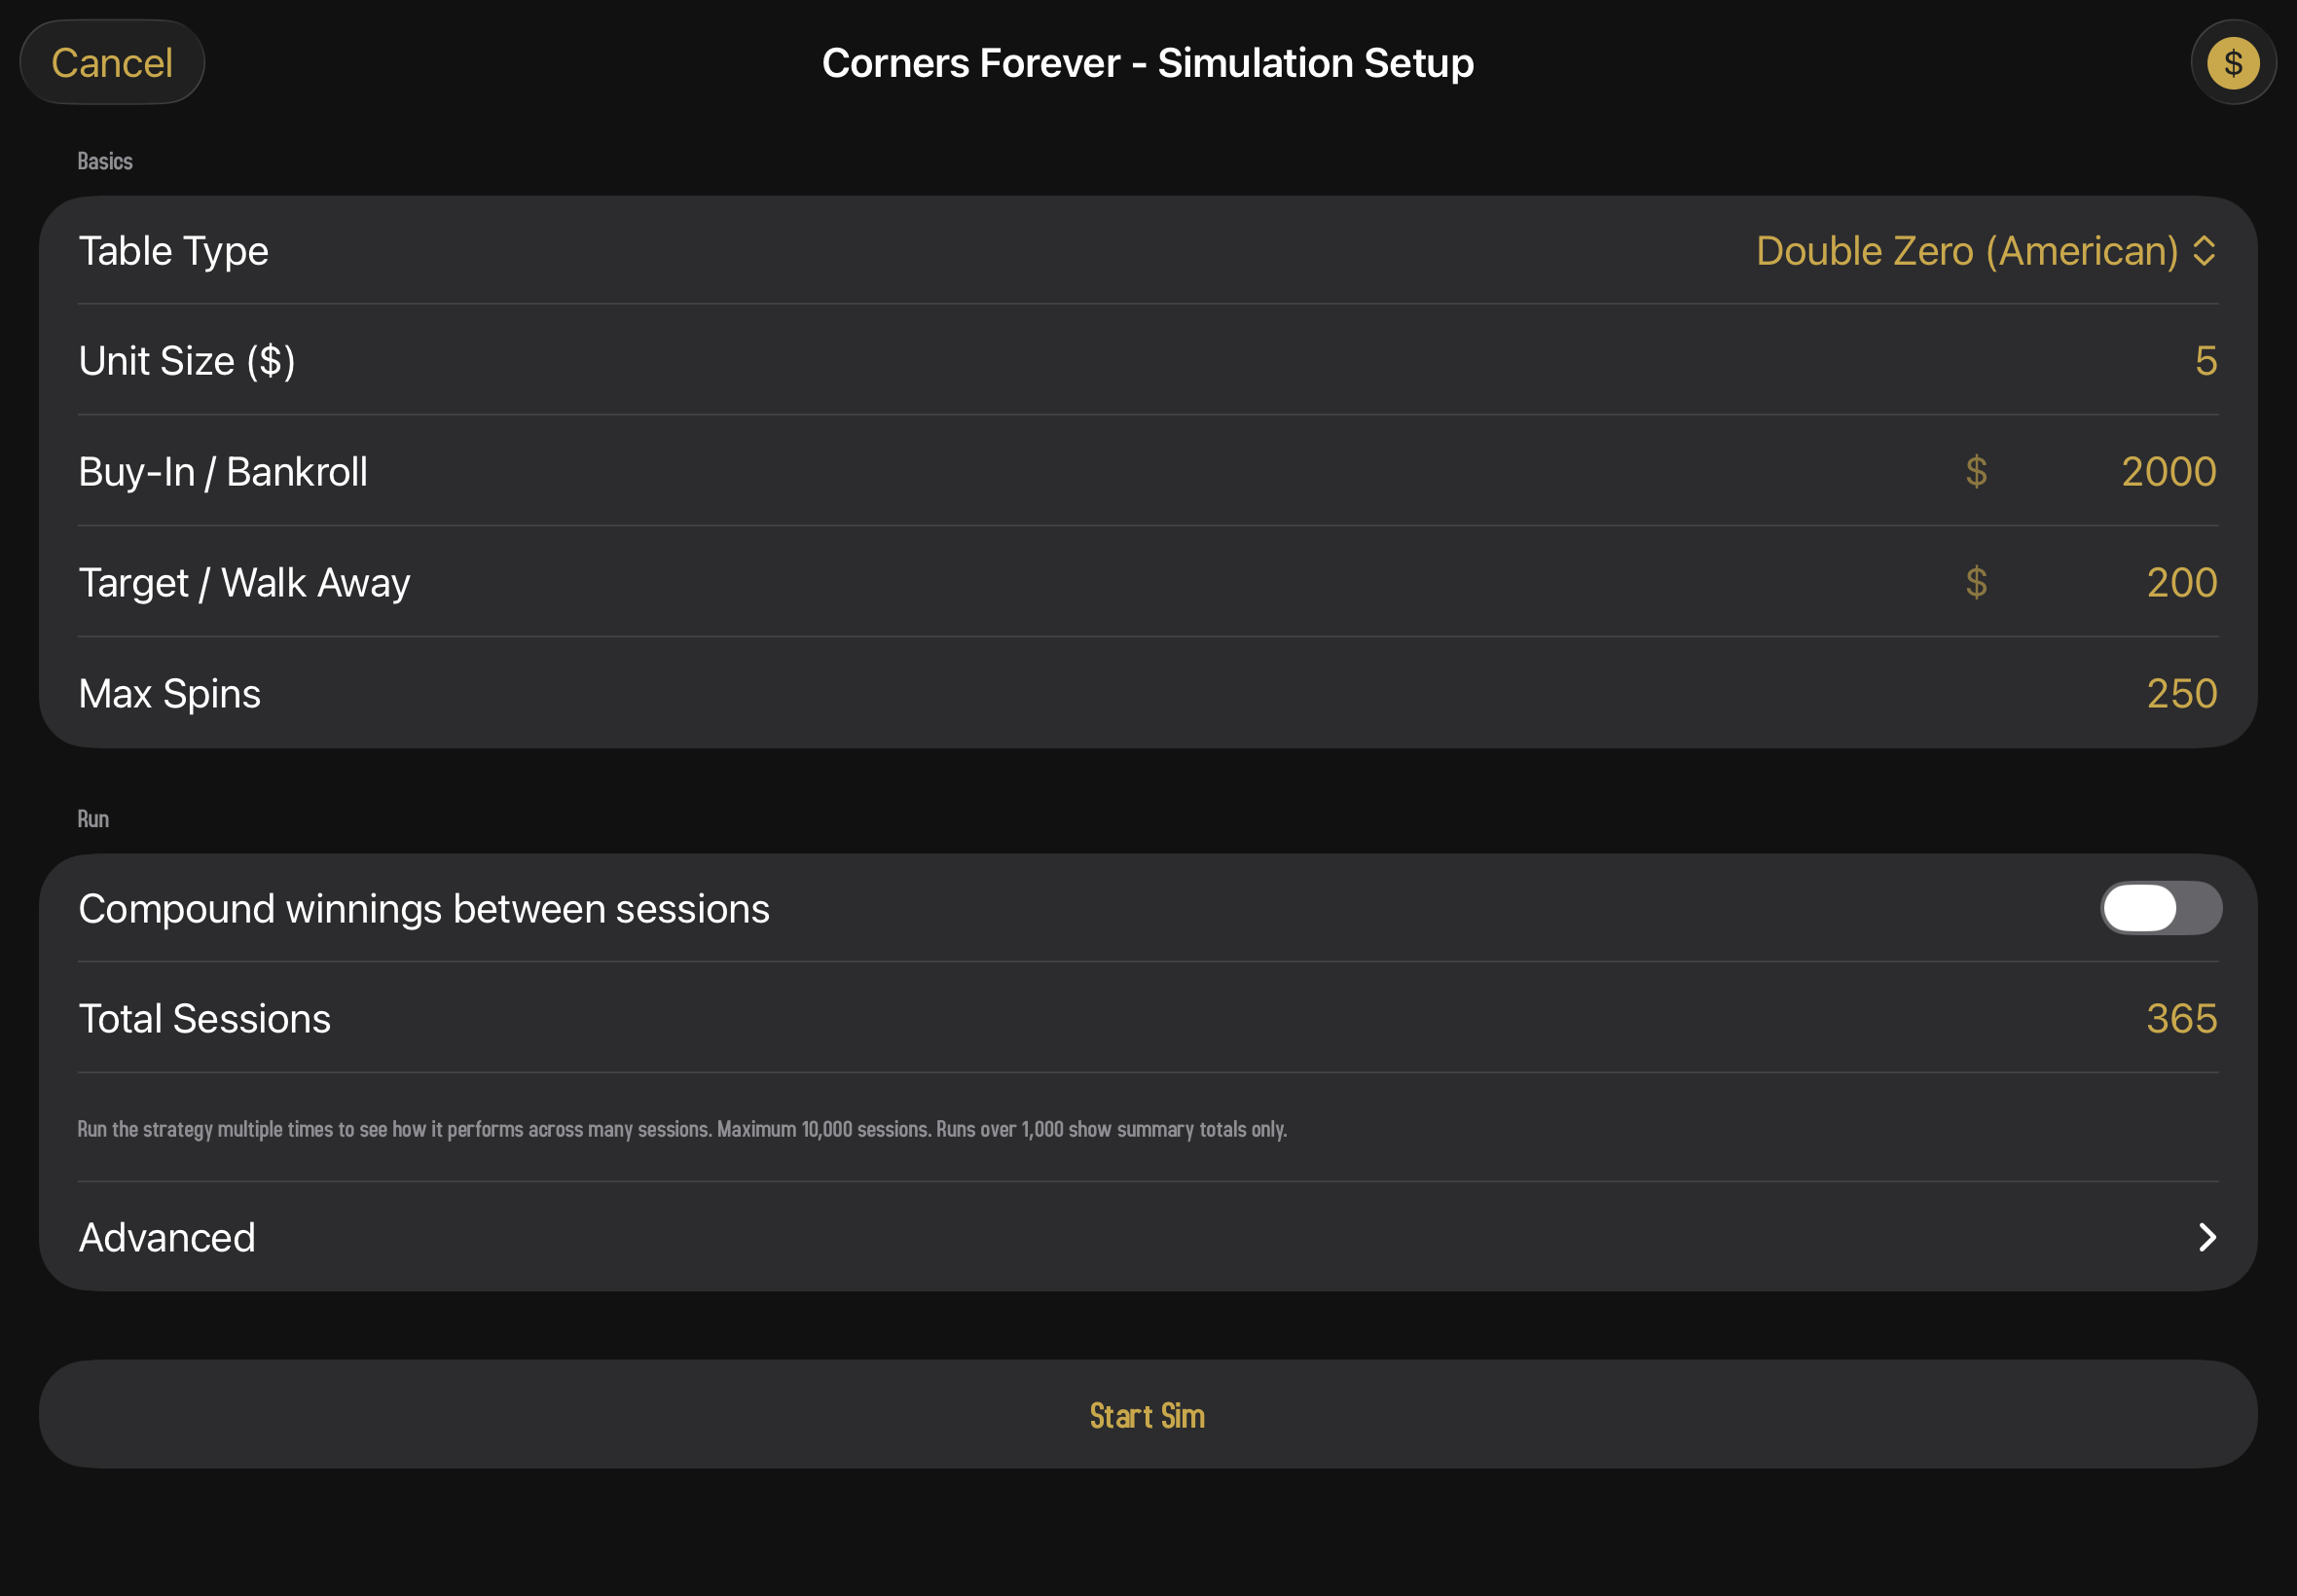
The setup screen is a form with three sections: Basics, Run, and a collapsed Advanced. Every field starts with the strategy's saved values, and you can override anything you want without modifying the strategy itself.
Basics
- Table Type. European (single zero), American (double zero), or Triple Zero. The house edge is different for each, so the strategy's results will be too.
- Unit Size. How much one chip is worth in dollars. Changing this rescales Buy-In and Target so the number of units stays the same — drop a $100 unit to $10 and a $10,000 bankroll automatically becomes $1,000, with the profit target scaled to match.
- Buy-In. Your starting bankroll for each session.
- Target / Walk Away. The profit target; once a session reaches it, that session ends in a "win."
- Max Spins. The hard ceiling; sessions end after this many spins regardless.
The $ button in the top-right of the setup screen flips Buy-In and Target between dollar amounts and unit multiples. It's the same app-wide toggle used by the graph editor, the node inspector, and the wager editor — flip it anywhere and it's flipped everywhere. With units showing, a $2,000 buy-in at a $10 unit size reads as 200 u.
Run
The Run section controls what the simulator actually does with those basics — how many independent sessions to run, and whether to chain them together by compounding winnings between sessions.
- Compound winnings between sessions. Off by default. When on, each "cycle" starts at the buy-in and scales bankroll, target, and unit size up after every winning session, ending when the bankroll has multiplied by your chosen number of doublings or has gone bankrupt.
- Total Sessions (or Total Cycles when compounding is on). How many independent runs to execute.
Each session uses a fresh sequence of random spins. Running 100 sessions tells you a lot more than running just one. It shows you the range of outcomes you'd actually see if you played this strategy over and over.
On the free tier, the parameter fields are read-only (every run uses the strategy's built-in defaults) and the total sessions count is capped at a small number. Subscribers can customize freely and run up to a thousand sessions at once.
Advanced
An Advanced disclosure sits at the bottom of the Run section, collapsed by default. Tap it to expose the realism toggles. Both are off by default and both are subscriber-only.
- Ignore exit conditions. Plays every session all the way to Max Spins, ignoring the profit target and the bust line. Useful when you want the natural shape of the Final P/L distribution without the bimodal "either I won small or I busted big" pattern that exit conditions force on the data. Sessions can finish with negative bankrolls in this mode, which is intentional.
- Ignore table min and max. Removes per-bet table caps so escalating sequences (like a deep Martingale) can keep doubling past what a real casino would allow. Leave it off if you want to see the strategy fail honestly against the table; turn it on if you want to study the math without the cap getting in the way.
When compounding is turned on, the Advanced disclosure swaps to show Max Sessions / Cycle instead — the hard ceiling on how many sessions a single cycle will chain before giving up.
Start Sim
When you're ready, tap Start Sim. A progress indicator appears while the app churns through the spins. Even big runs (hundreds of sessions, thousands of spins each) finish in just a few seconds.
Multiple sessions at once
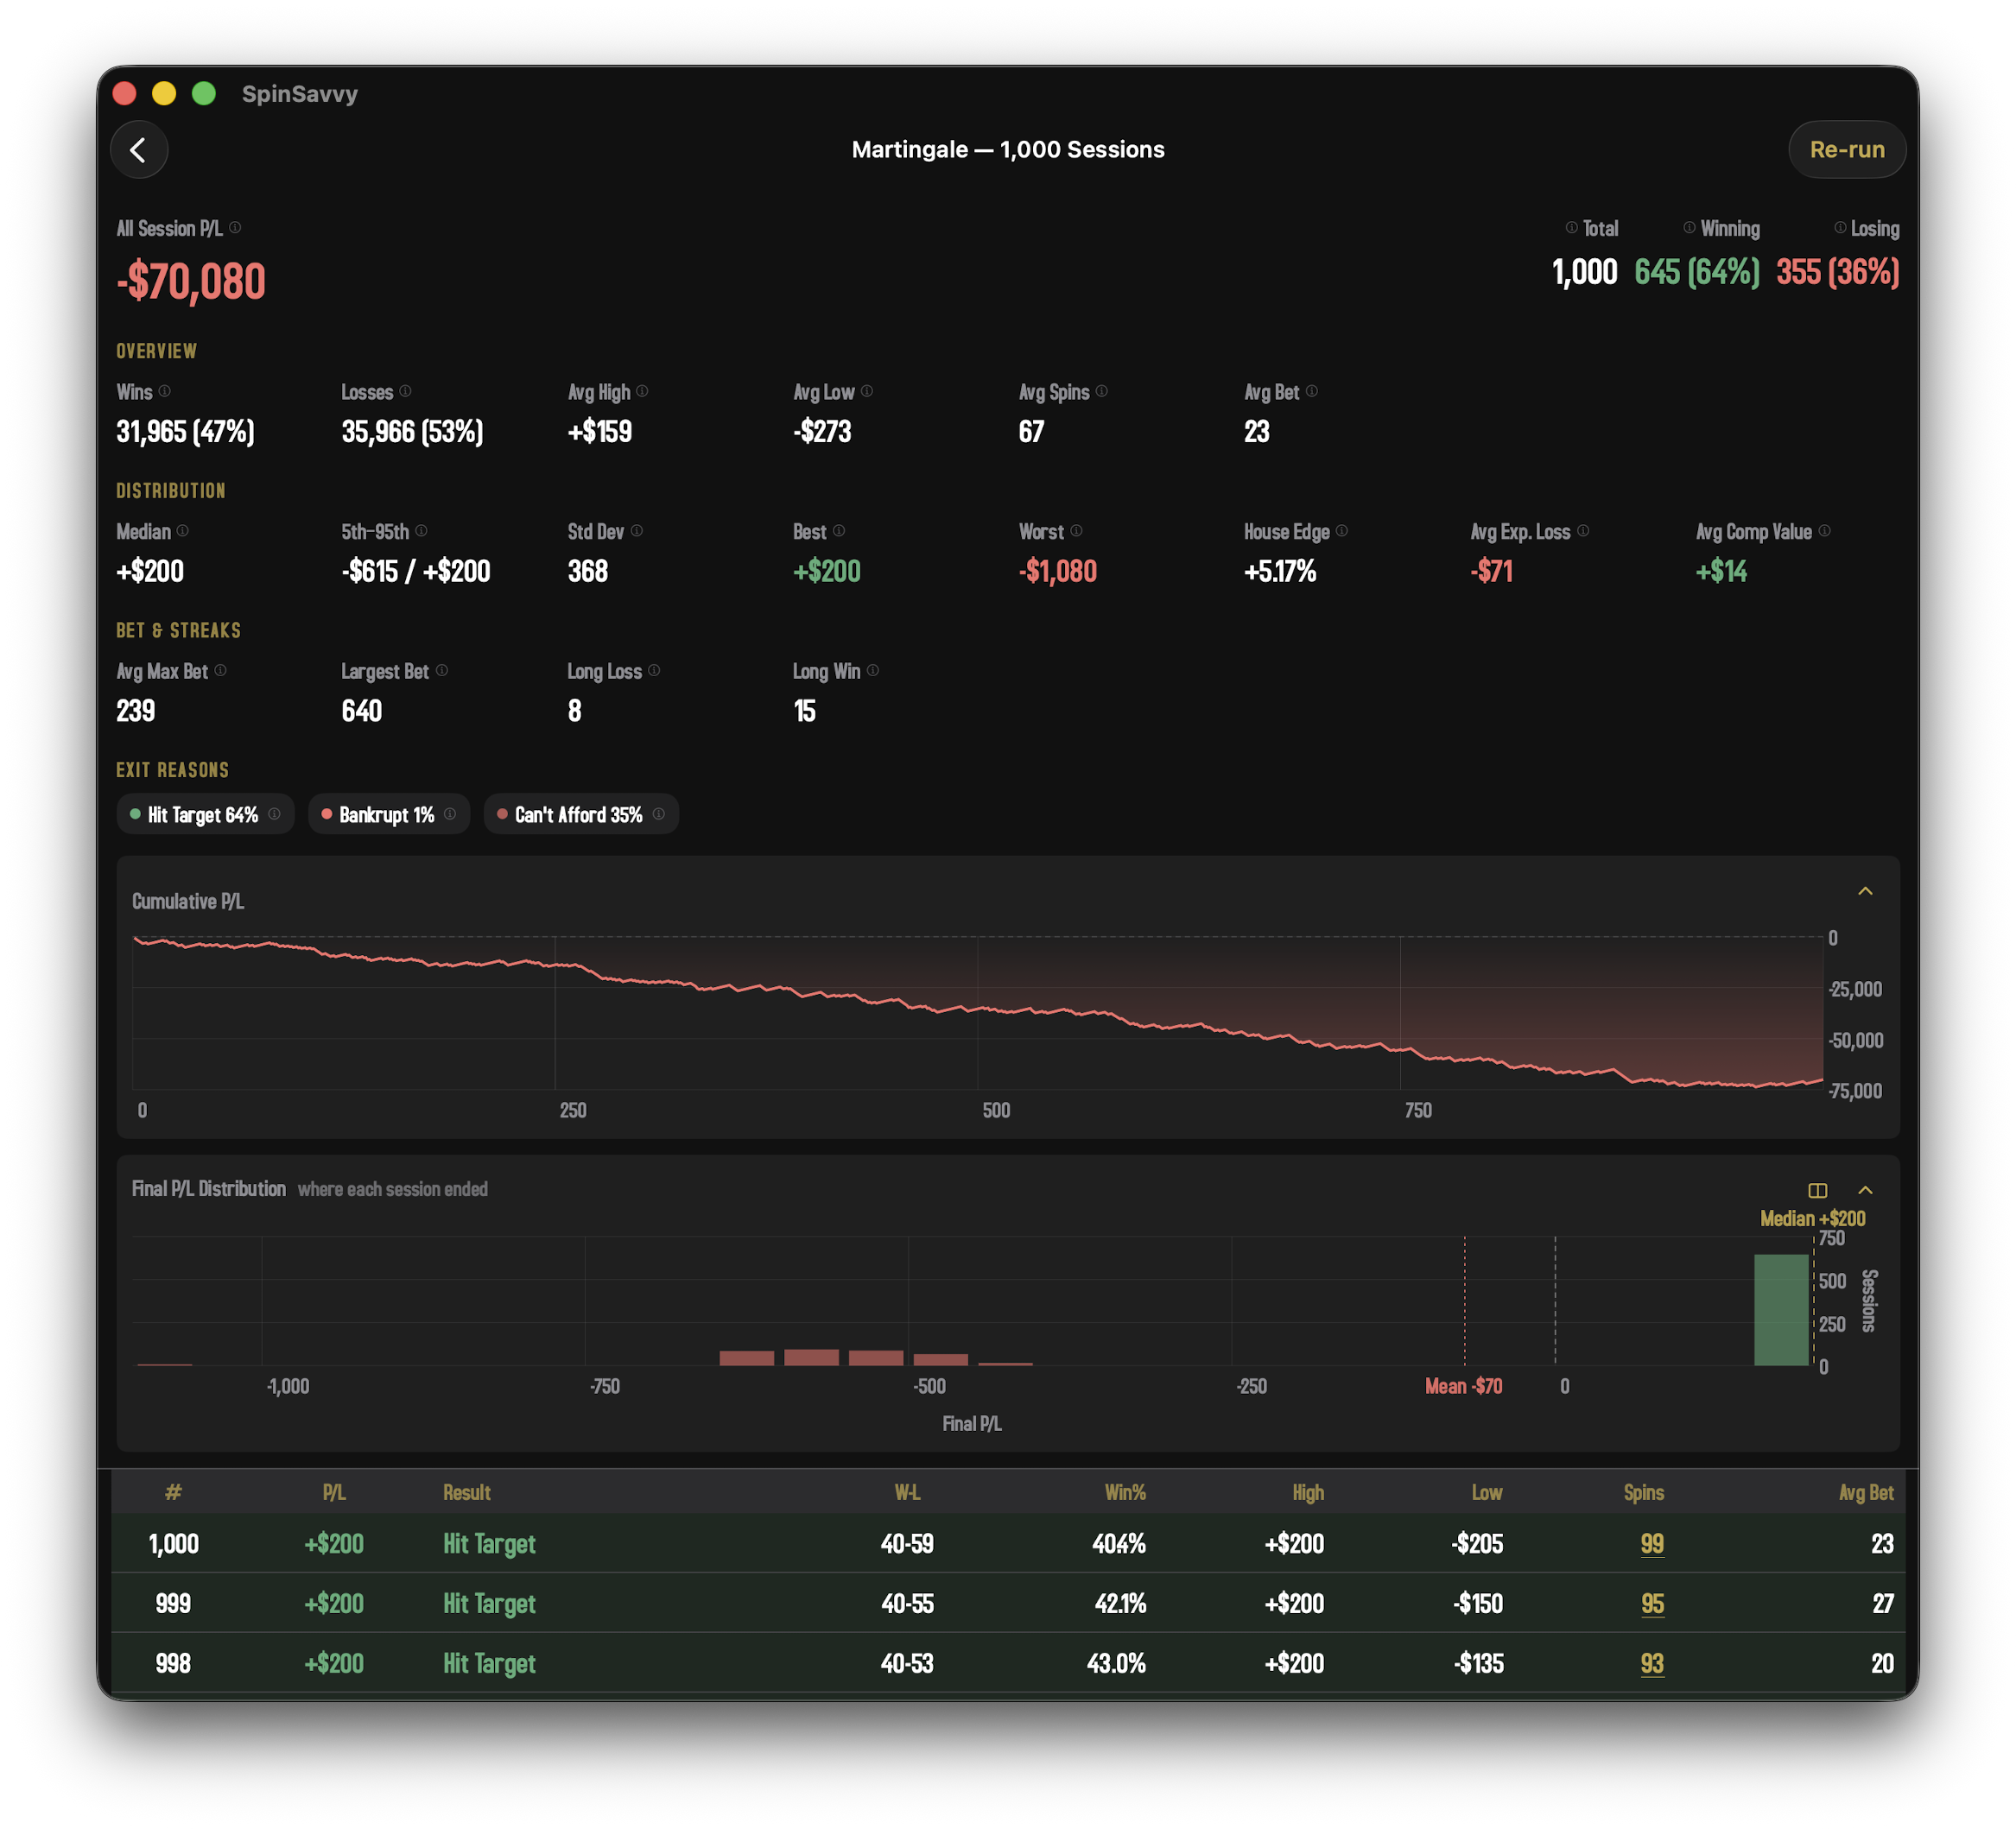
If you ran a Monte Carlo with more than one session, the app shows you every meaningful angle on the run all at once. The summary at the top is grouped into three labelled sections so the numbers you actually need are easy to scan.
Overview
The familiar basics — total winning spins, total losing spins, average session high and low, average spin count, and average bet size. This is the "what happened on a typical session" snapshot.
Distribution
This is where the run gets honest with you. Averages can hide a lot — a strategy that wins small most of the time and busts big occasionally has a perfectly cheerful average and a brutal reality.
- Median. The middle session. Half did better, half did worse. Often very different from the mean — that's the point of showing both.
- 5th–95th. The range that contains 90% of sessions. The remaining 5% on each tail is where the surprises live.
- Std Dev. How spread-out the session results are. Roulette has high variance; this number quantifies it.
- Best and Worst. The single best and worst sessions in the entire run.
- House Edge. The realized house edge for this run — dollars lost divided by dollars wagered. Should converge toward the table's theoretical edge (≈2.7% for European single-zero, ≈5.26% for American double-zero, ≈7.69% for triple-zero) as session counts grow.
Bet & Streaks
Useful for escalation strategies like Martingale, where the size of the bet you're forced to make matters as much as how often you win.
- Avg Max Bet. Across all sessions, the average of the biggest single bet placed in each one.
- Largest Bet. The single biggest bet placed in any session of the run. Worth comparing to a real-world table maximum.
- Long Loss and Long Win. The longest losing and winning streaks observed in any session.
Exit Reasons
Below the stats sections, a row of color-coded chips shows you the breakdown of why sessions ended. What percent hit the profit target, what percent went bankrupt, what percent couldn't afford the next bet, what percent ran out the max-spins clock, what percent walked away because a required wager would have exceeded the table cap, and so on. A strategy that "wins" 80% of the time isn't necessarily a winning strategy if the 20% of busted sessions lose more than the 80% of winners gain.
Bankrupt and Can't Afford are split on purpose. Bankrupt means the bankroll hit zero on a spin — the last chip went to the house. Can't Afford means the bankroll never reached zero but the next wager the strategy called for was bigger than what was left, so the session ended without that bet ever being placed. A run that's heavy on Can't Afford and light on Bankrupt is telling you the bet size outran the bankroll, which is the signature failure mode of escalating strategies like Martingale.
The Table Limit chip is the related one to watch. If your bankroll says the next Martingale doubling is fine but the table max says it isn't, the session ends right there. A run with a large Table Limit slice is telling you the strategy looks solvent on paper but can't actually be played at a real table.
Final P/L Distribution
The histogram below the cumulative P/L chart is where the run shows its true shape. Each bar is a P/L range, and its height is how many sessions ended in that range. Losing bars are red, winning bars are green, and a dashed vertical line marks the median. The break-even line at zero is always drawn so you can see at a glance how much of the run finished above or below water.
Histograms reward a careful look. A clean bell curve centered just below zero is the boring, honest signature of a fair-but-house-edged strategy. A bimodal "two peaks" shape (one cluster near the profit target, another in the bankrupt tail) is what exit conditions usually produce, and it can hide a brutal expected value behind a respectable-looking win rate. A long left tail is a strategy that wins small most of the time and loses big occasionally. The Martingale family is the classic example.
The icon in the chart's header toggles a split view that draws the losing half and the winning half as two separate histograms side by side, each with its own bin sizing. This is the easiest way to read bimodal runs, where a single chart squashes both clusters into a few wide bins. Tap the chevron in the corner to collapse the chart out of the way; tap the collapsed bar to bring it back. The chart appears whenever the run is large enough for the distribution to be meaningful (at least ten sessions).
If the histogram looks suspiciously bimodal, that's the profit target and bust line doing the shaping, not the strategy. Re-run with Ignore exit conditions turned on to see the underlying continuous distribution. Bell-shaped and centered below zero is what you'd expect; anything fatter on the left side is where the real risk lives.
Every stat label has a small ⓘ icon next to it. Tap the label to open a short explanation of what the number means, why it matters, and how to read it. Same for every exit-reason chip. The popover stays open until you tap outside.
This is the most honest view of a strategy. A strategy that wins 60% of sessions for small profits but loses 40% in massive blowouts may look fine in the Overview row and disastrous in the Distribution row. Read both before drawing conclusions.
Reading the results
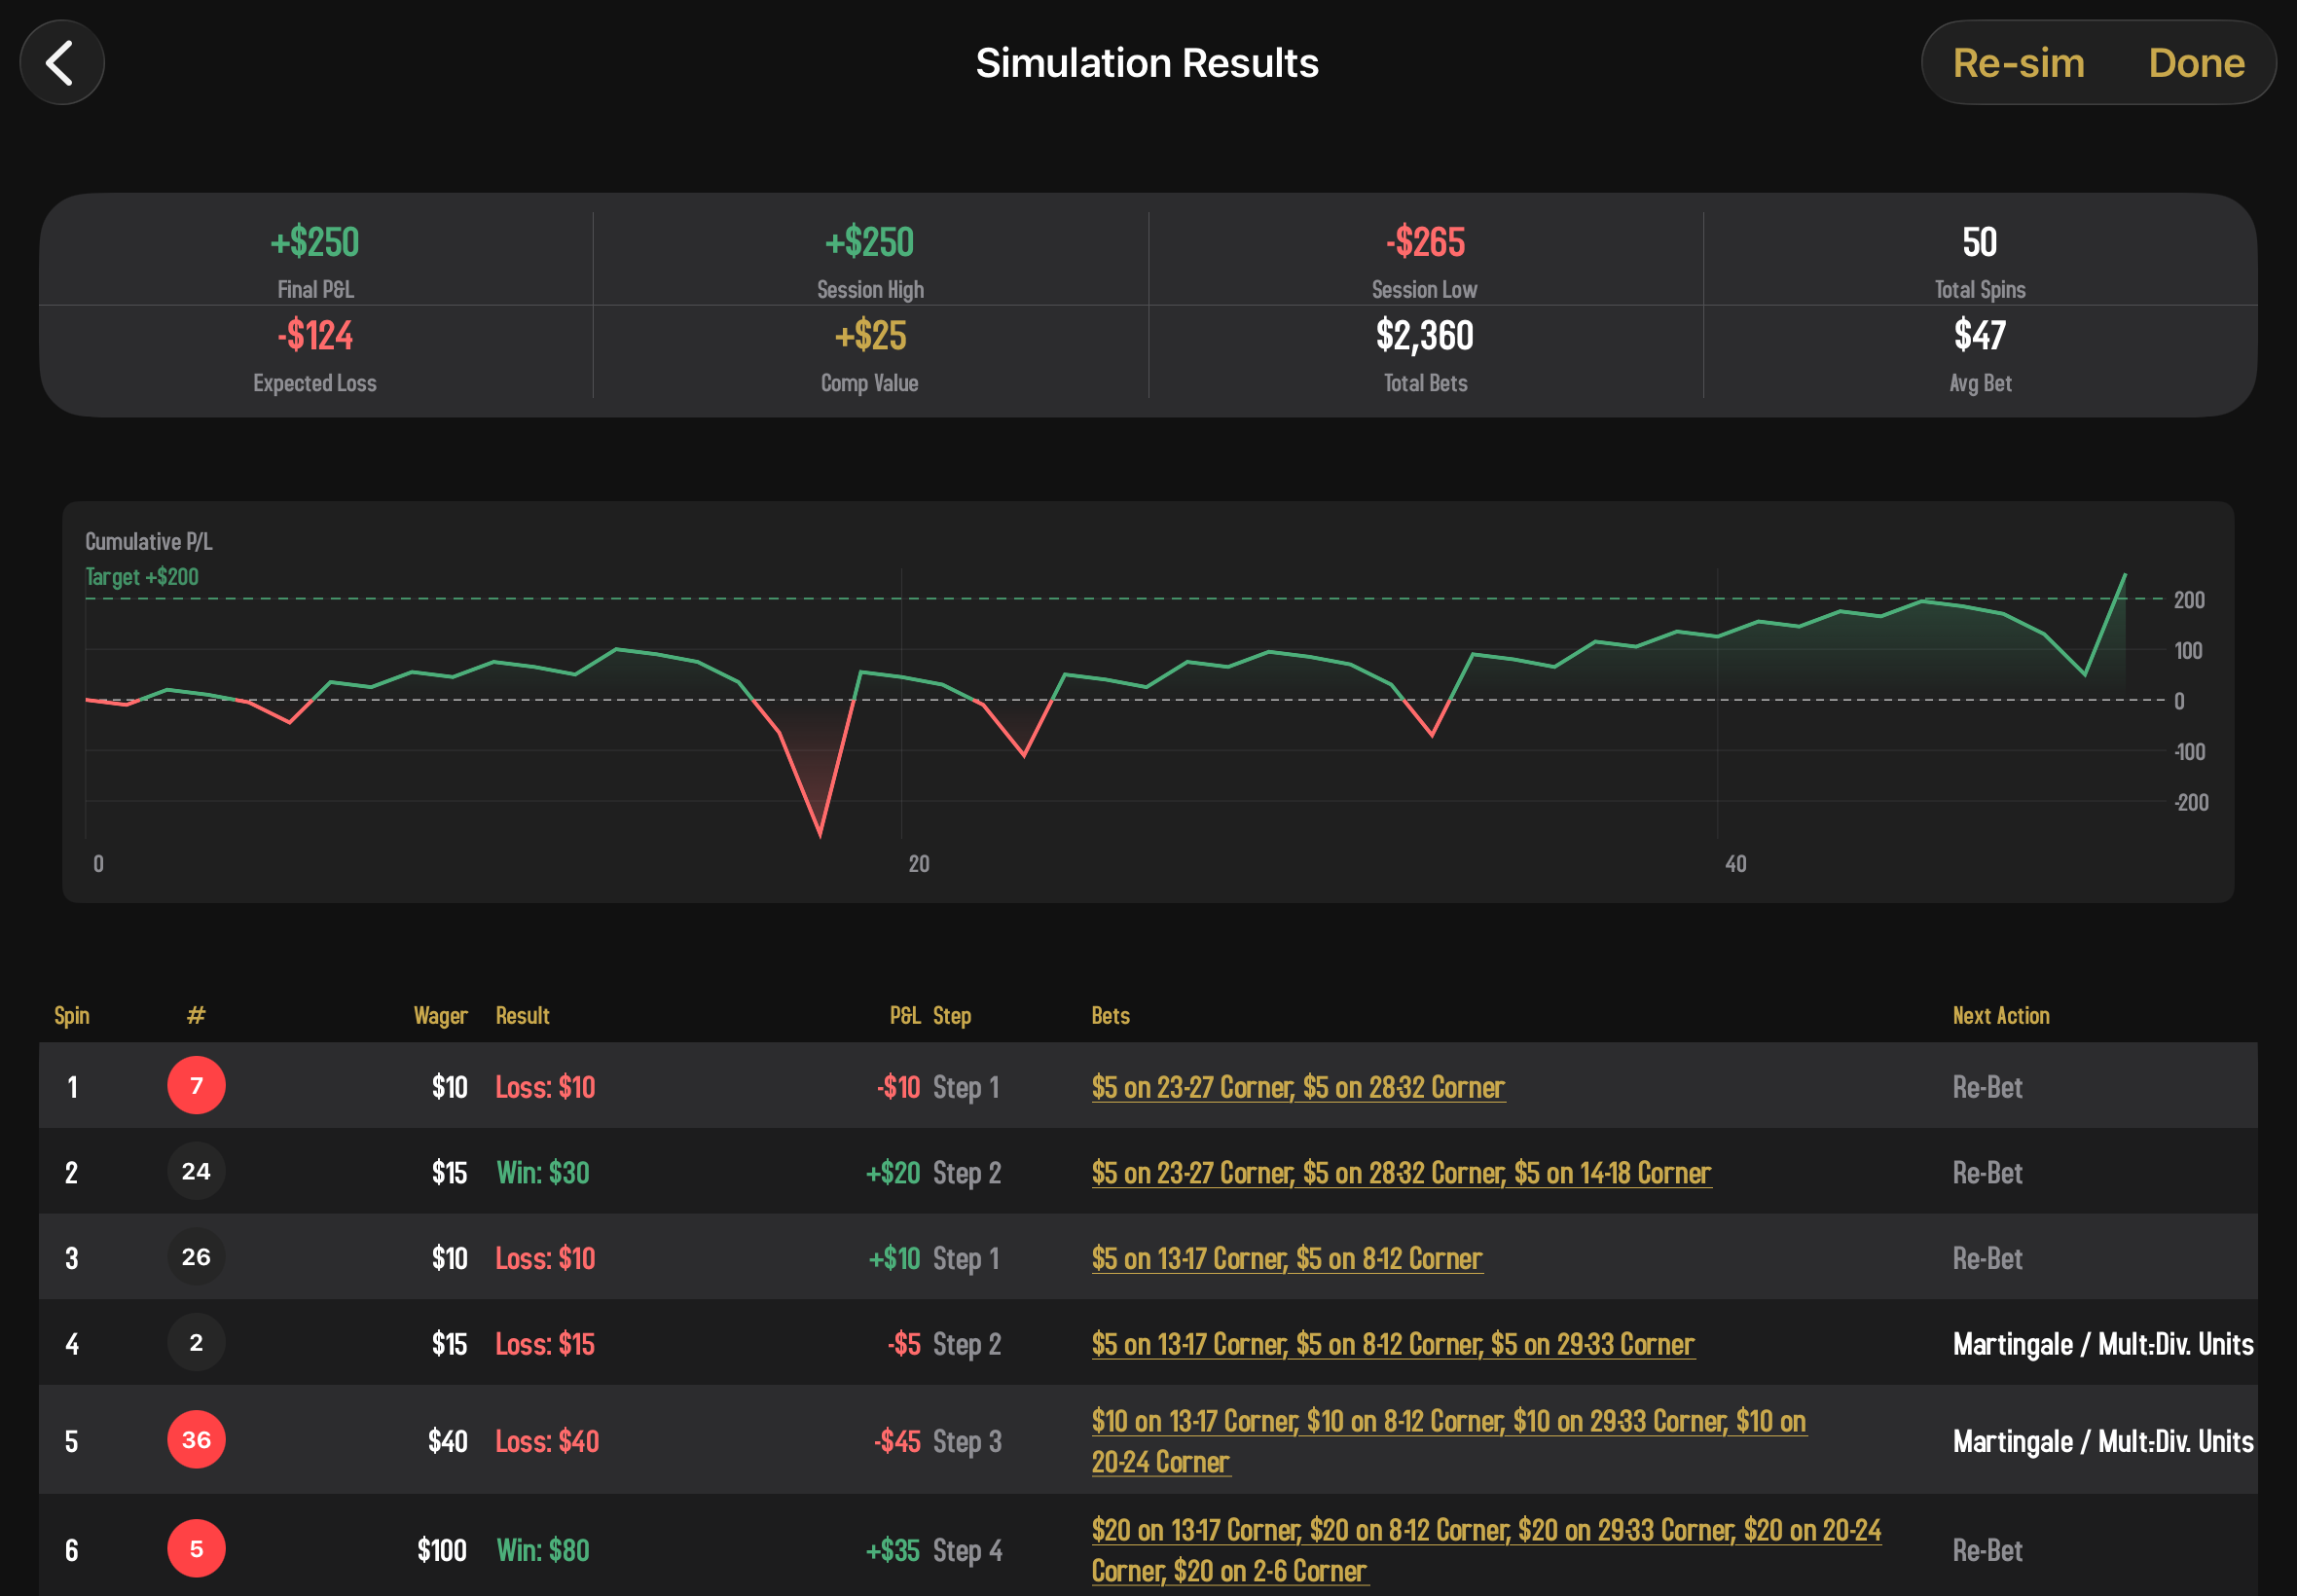
Tap into any individual session from the list to dig into how that one session played out. There's a lot here, so let's walk through it.
The headline stats
Across the top, four numbers summarize the run:
- Final P&L. Did this session end up or down? Green for profit, red for loss.
- Session High. The biggest your bankroll got at any point during the run.
- Session Low. The smallest it got. Useful for understanding drawdown.
- Total Spins. How many spins it took before the session ended.
The cumulative P&L chart
A line chart of your bankroll over time. The x-axis is the spin number; the y-axis is your running profit and loss. Watch the shape. Does the line climb steadily, or does it claw upward and then crater? A horizontal line shows your target profit, so you can see exactly where the strategy would have walked away (if the run hit the target).
The spin log
Below the chart is a row-by-row table of every single spin: the winning number, how much was wagered, whether the spin won, lost, or pushed, the spin's individual P&L, and your running total. Rows are color-tinted (green for wins, red for losses, gray for pushes) so you can scan a long log and spot the streaks at a glance.
Tap any row to open a detail sheet that shows you exactly which wagers were placed for that spin. Useful for understanding what the strategy actually did when something interesting happened.
Re-running
Found an interesting result? Tap Re-Sim to run the simulation again with the exact same parameters but a fresh set of random spins. Run it a dozen times and you'll start to see the strategy's true personality. Does it tend to land in the same range, or are results all over the map?
Roulette in Spin Savvy uses a high-quality random number generator. Every spin is genuinely independent; past results don't influence future ones. That means simulation results are honest: there's no built-in luck or guarantee. A strategy that loses on average in simulation will lose on average at any real table too.
What gets saved
Nothing. Simulations are a throwaway tool for sizing up a strategy. Once you leave the results screen, the run is gone. Only sessions you actually play get recorded in your Sessions history.