Sessions
Your complete history. Every spin, every wager, every dollar made or lost.
Every time you play in real time, Spin Savvy automatically records the session. It captures the full sequence of spins, every wager you placed, and how your bankroll moved through the run. The Sessions screen is where all of that history lives, and where you go to learn from it.
Only Play Mode sessions are saved here. Simulation runs are a throwaway tool for sizing up a strategy and aren't recorded; once you back out of a sim's results, the run is gone.
Your session history is stored locally on the device that recorded it. Spin Savvy never uploads sessions, wagers, or bankroll history to the cloud. Only strategies that you explicitly submit for community review ever leave your device.
Opening Sessions
From the home screen, tap Sessions. You'll see a list of every past play session, sorted by date with the most recent at the top.
The summary card
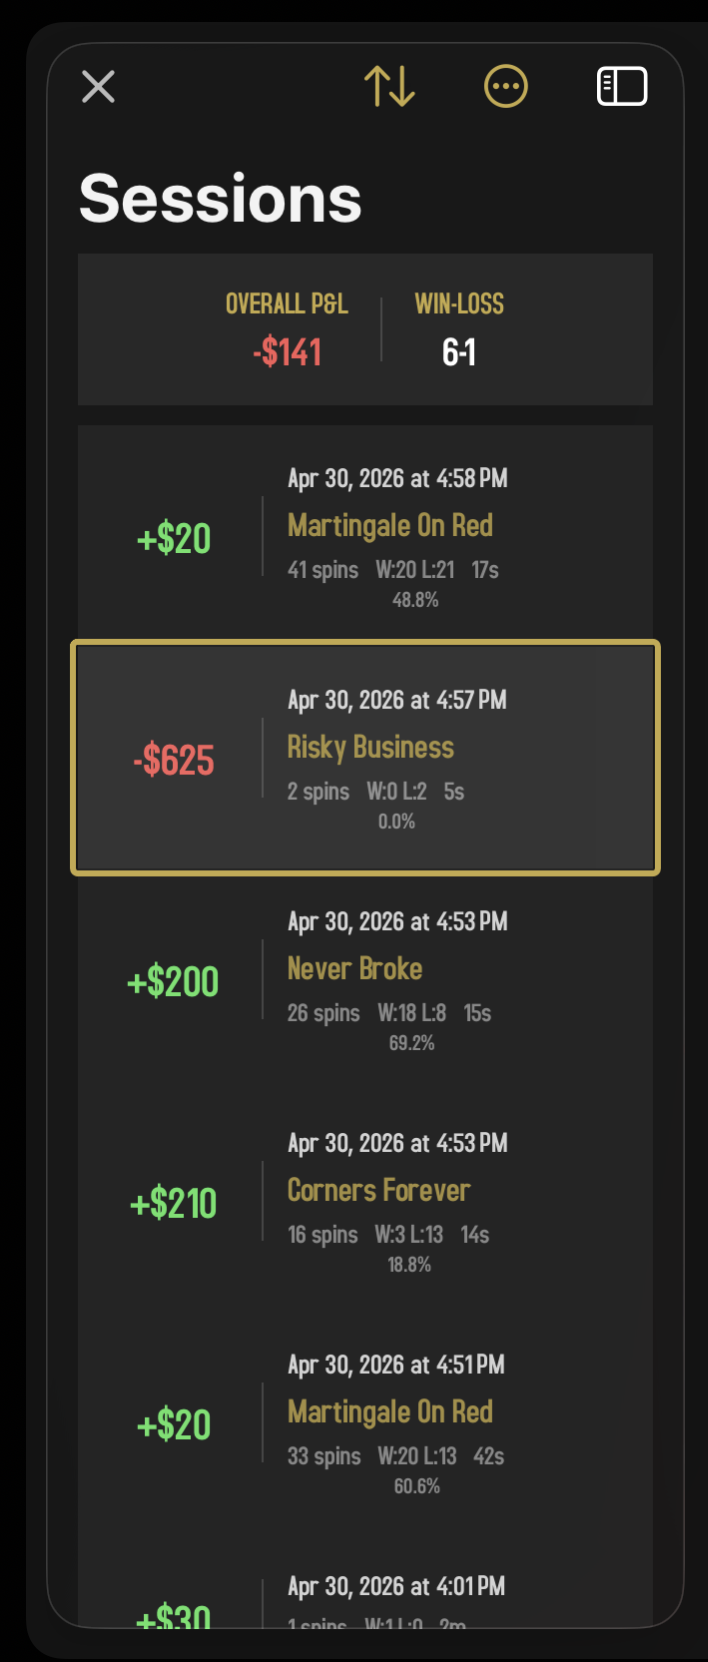
At the top of the list, a tidy summary tells you how you've been doing in aggregate:
- OVERALL P&L. Your total profit or loss across every session combined.
- WIN-LOSS. How many sessions you finished in the green vs in the red.
It's easy to feel good after a winning streak and forget about the losing ones. The summary card is a deliberate reality check: your actual aggregate over time, not just whatever's freshest in memory.
Reading a session row
Each row in the list shows:
- P&L. Your net result for the session, sitting big on the left of the row. Green if you finished up, red if you finished down.
- Date and time. When the session happened.
- Strategy name. If you played with one (otherwise it's a manual session).
- Footer line. A compact summary: total spins, the W:N L:N tally of winning vs losing spins, the session's duration, and the win percentage.
Tap any row to open the full breakdown.
Sorting
A small sort control near the top lets you reorder the list. Sort by:
- Date. Newest or oldest first.
- Strategy. Alphabetical by strategy name.
- P&L. Biggest wins or biggest losses on top.
- Win %. Best- or worst-performing first.
- Length. Longest or shortest sessions.
Useful for spotting your best and worst runs at a glance.
Session detail
Tap a session and the detail panel opens. This is where the magic is.
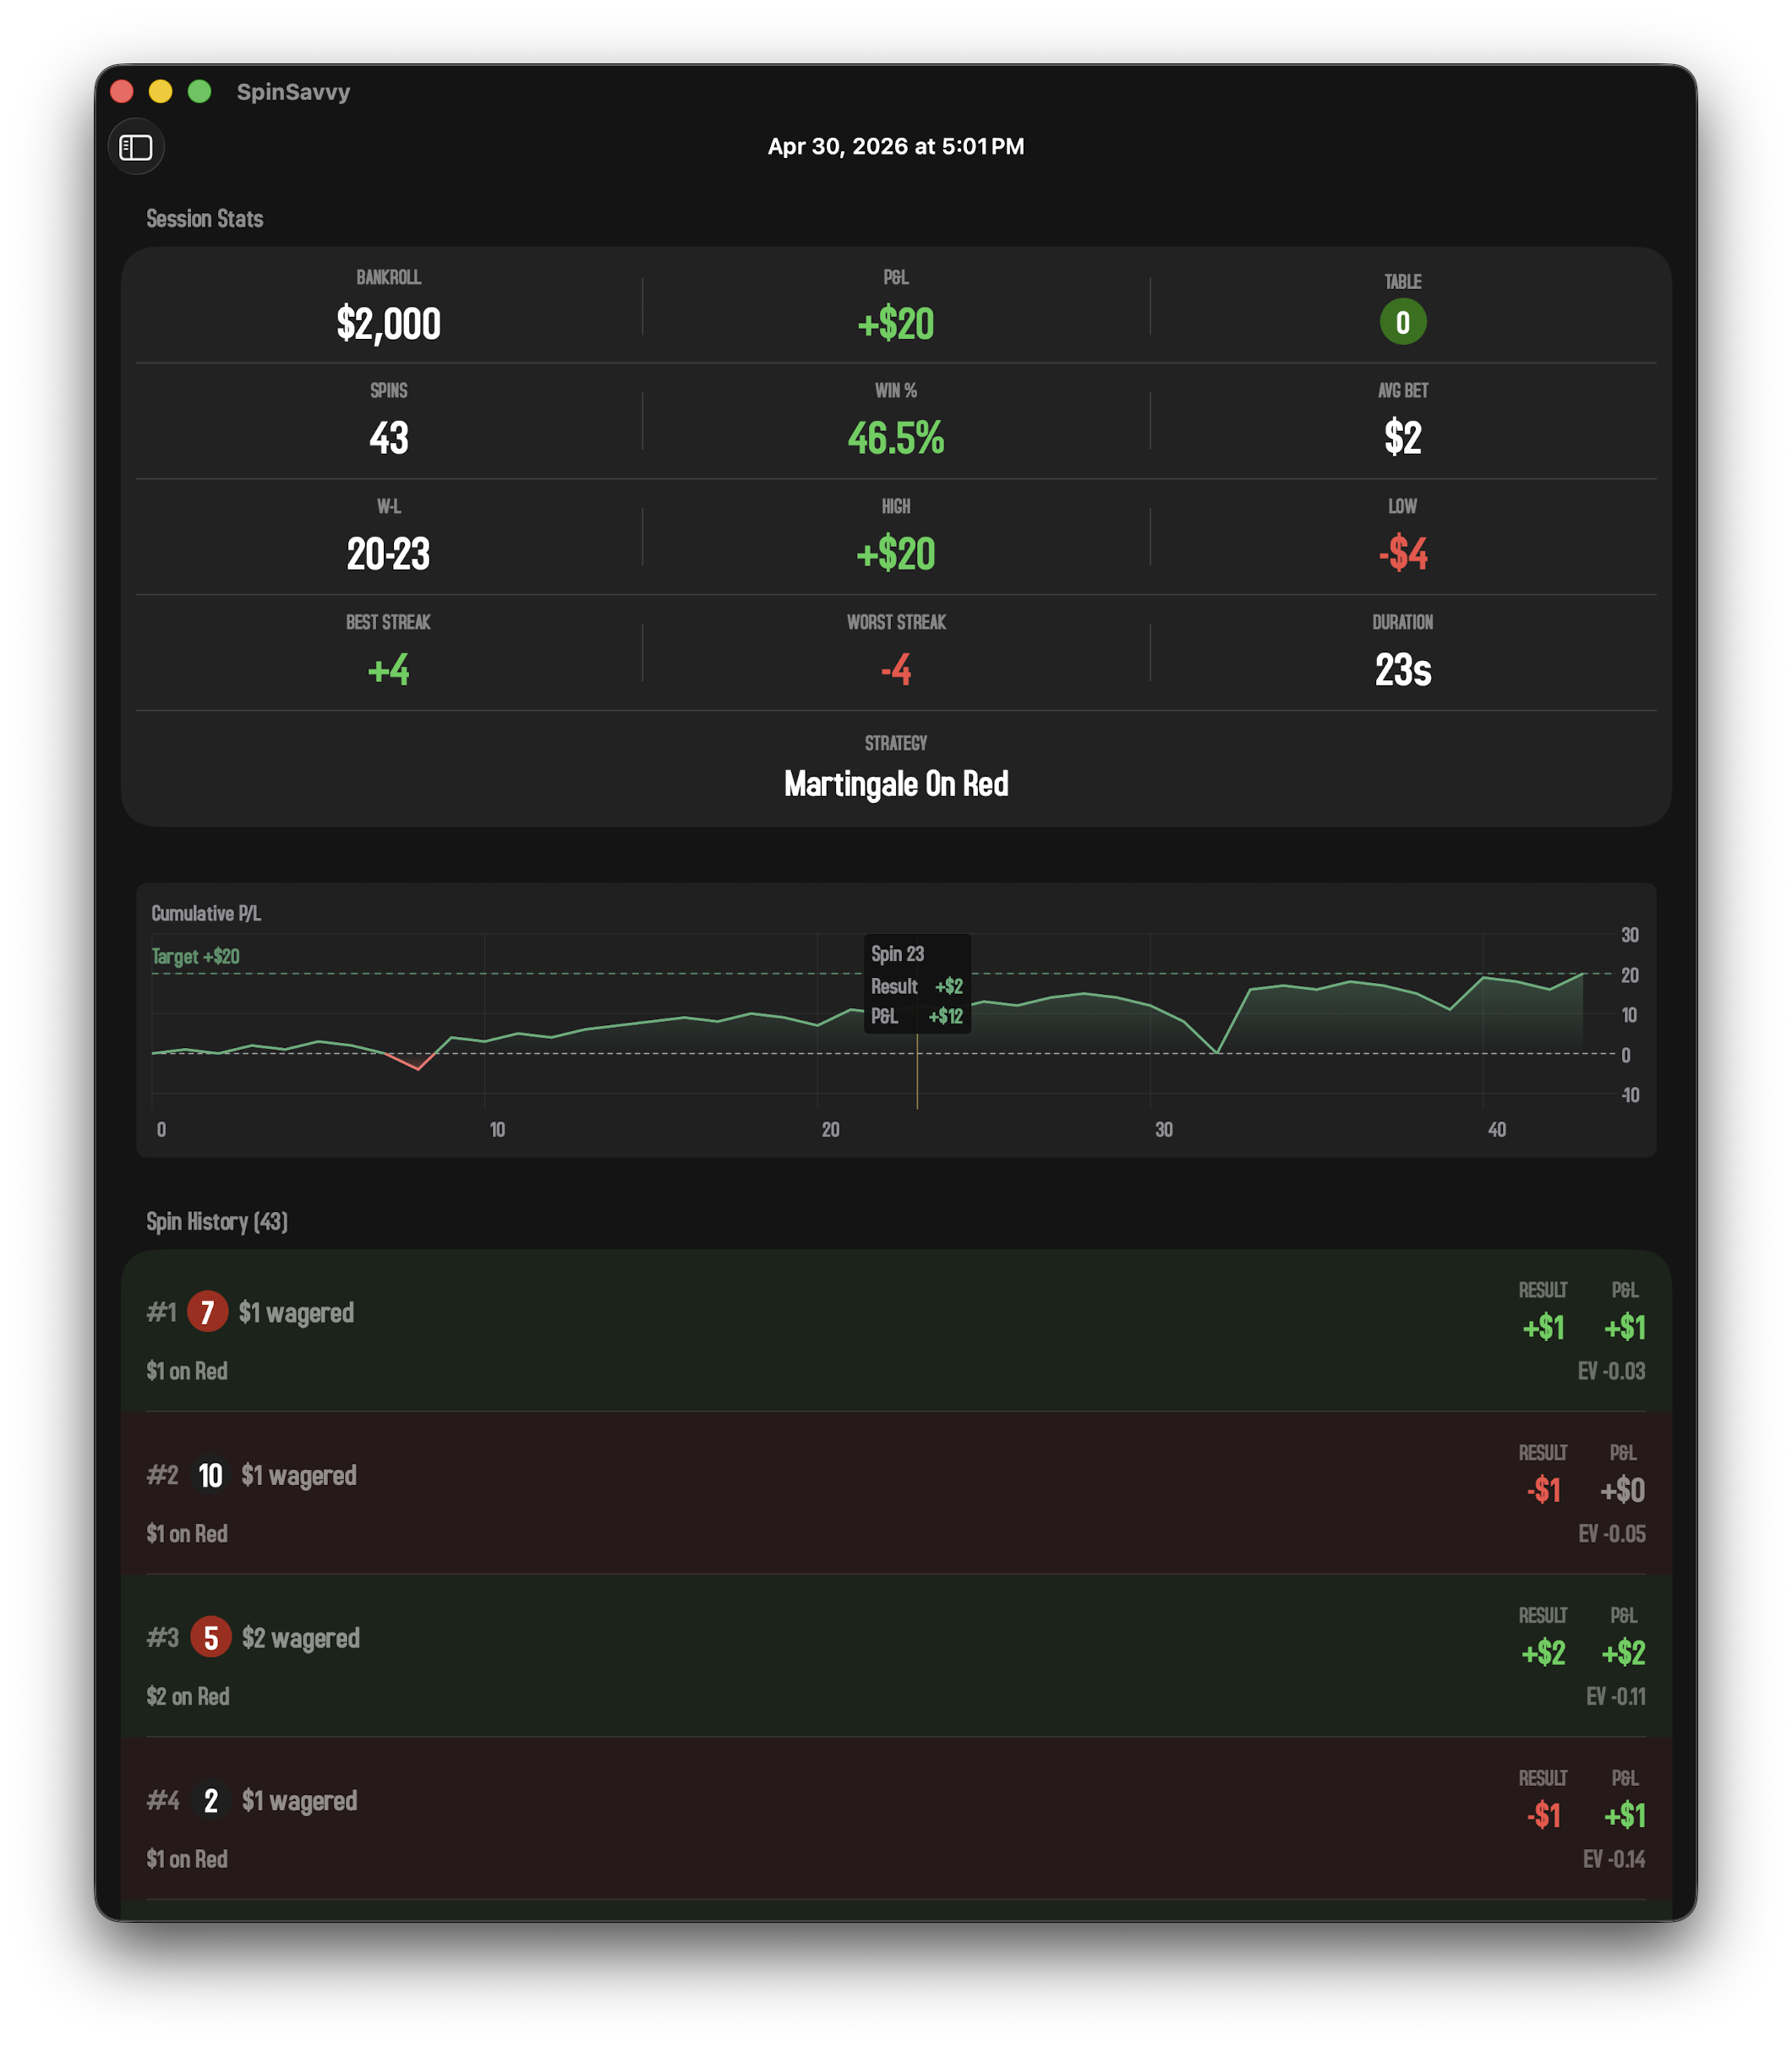
Stats header
Across the top of the detail panel, the headline numbers from this session:
- Total spins
- Wins, losses, and pushes
- Win rate
- Longest winning streak
- Longest losing streak
- Starting bankroll
Cumulative P&L chart
A line chart of how your bankroll moved through the session, spin by spin. Big upward streaks pop out clearly; so do the dips. The shape of the curve is often more telling than the final number. A smooth climb is a very different experience from a wild ride that happens to end at the same place.
Spin history
The full transcript of the session, one row per spin:
- Spin #. The order the spin happened in.
- Pocket. The winning number.
- Wagers. A summary of what you bet.
- Result. Won, lost, or pushed.
- P&L. What this individual spin made or cost you.
- Running P&L. Your cumulative total going into the next spin.
- Expected Value. What you would expect that bet to return on average over many spins.
Tap any spin to open a detail sheet showing every individual wager that was on the table for that spin. Helpful when you want to see exactly what your strategy did at a particular moment.
Deleting sessions
Swipe a session row from right to left to reveal a Delete button. You'll be asked to confirm before it's actually removed. Once gone, a session can't be recovered, so be sure.
Free-tier limits
On the free tier, only your most recent sessions are accessible. Older sessions show up in the list but are grayed out and locked. Tap them and the paywall will appear. Subscribing unlocks your entire history.
Your old sessions aren't deleted; they're just locked. Subscribe at any time and they'll all become accessible again immediately.
What sessions are good for
A session log is more than a record of wins and losses. It's a research tool. A few things worth doing with it:
- Find your best and worst sessions. Sort by P&L. Look at what was different about each.
- Compare strategies. Sort by strategy name and look at the average results for each.
- Spot a tilt session. The one where you placed bigger and bigger bets after losses. The chart will give it away.
- Check your aggregate. The cumulative P&L on the summary card is the real scoreboard. It's hard to lie to yourself when the number is right there.